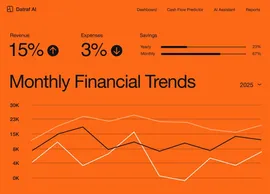
Dashboard app templates
Choose a working dashboard, connect your own data and metrics with AI, and stop rebuilding the same spreadsheet every Monday.
Templates
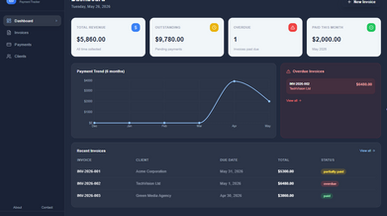
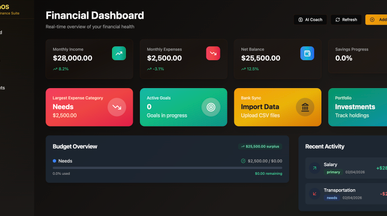
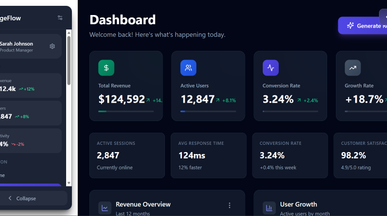
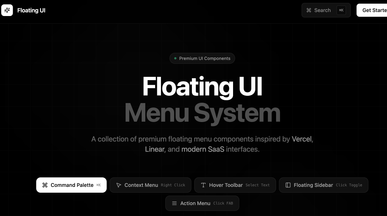

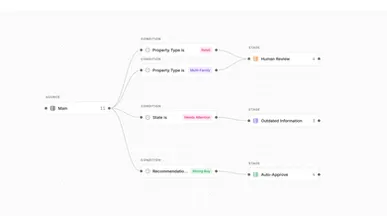
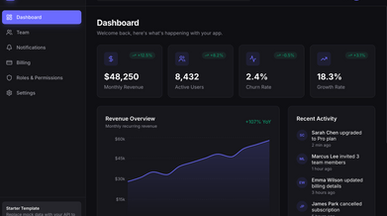
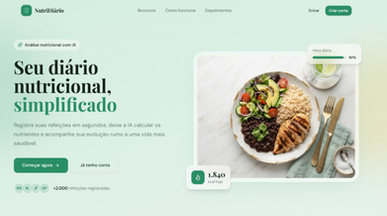
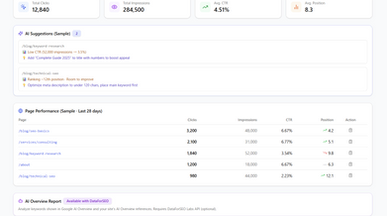
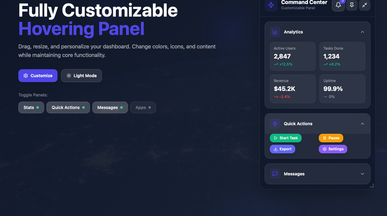
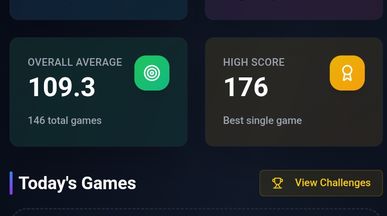
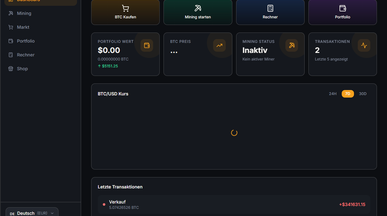
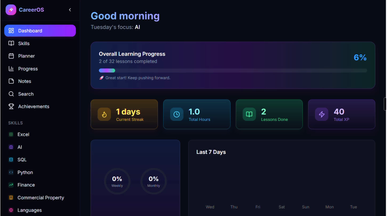
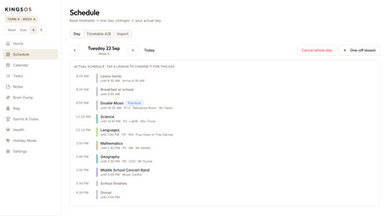
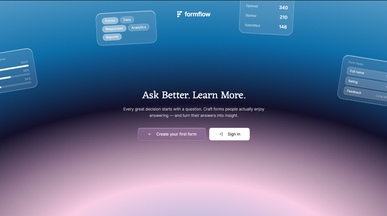
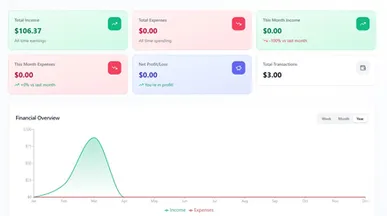
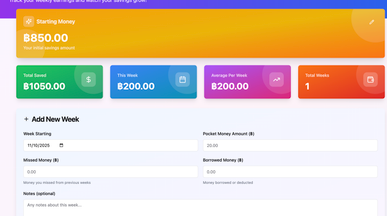
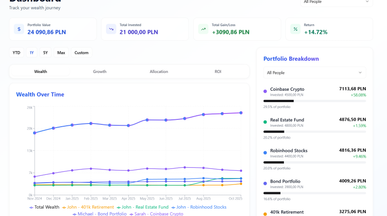
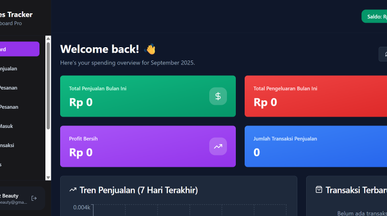
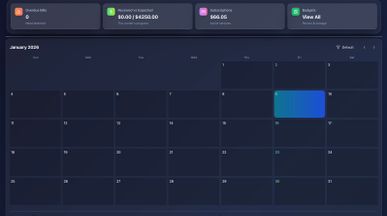
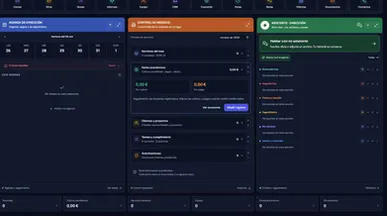
Dashboard app templates for a clearer view of your work
Know what’s moving forward and what needs your attention. Explore dashboard app templates for keeping track of team activity, business performance, and day-to-day priorities. Choose a starting point that puts the information you check most often within easy reach.
Shape your dashboard around what you need to see. With Base44’s AI app creator, you can customize charts, tables, and summary views, then add filters for relevant dates, teams, or projects. Put upcoming deadlines at the top of a project dashboard, or highlight active deals and progress toward targets in a sales overview.
Start with a few useful metrics and your own data. Arrange the details so you can move from a quick overview to a closer look, then refine the dashboard around the decisions you make every day.

Frequently asked questions
Restraint, mostly. The ones that get opened every day share this:
- One question per screen — if it answers five, it answers none.
- A comparison — a number without last month is decoration.
- The rows behind the number — the first thing anyone asks for.
- An obvious data freshness stamp — trust dies on stale figures.
- Filters people actually use — usually date, team and region.
- An export — someone will always need it in a spreadsheet.
What kills them: twenty tiles on one screen, vanity metrics nobody acts on, and a chart type chosen because it looks impressive.
The best dashboard app template is the one built around the decisions its viewers make, not the one with the most charts. Start with who will open it and what they need to see first, then pick the template closest to that job:
- Sales pipeline — stages, forecast, per-rep performance.
- Operations — throughput, backlog and what is late right now.
- Finance — revenue, costs and margin over time.
- Marketing — channel spend against outcome, not impressions.
- Client-facing report — one client's numbers, styled for them.
Clone the closest one and connect one real data source before adding a second — most dashboard projects fail on data plumbing, not on charts. The BI and analytics apps category covers the wider build.
Go ahead. Build it yourself.